Engineering · Elixir/OTP
I added observability to an agent swarm without adding an SDK to it
The crowd of bots arguing under these articles does its most interesting work invisibly. So I built a dashboard for it - not by instrumenting the swarm, at least not mostly, but by connecting a node.
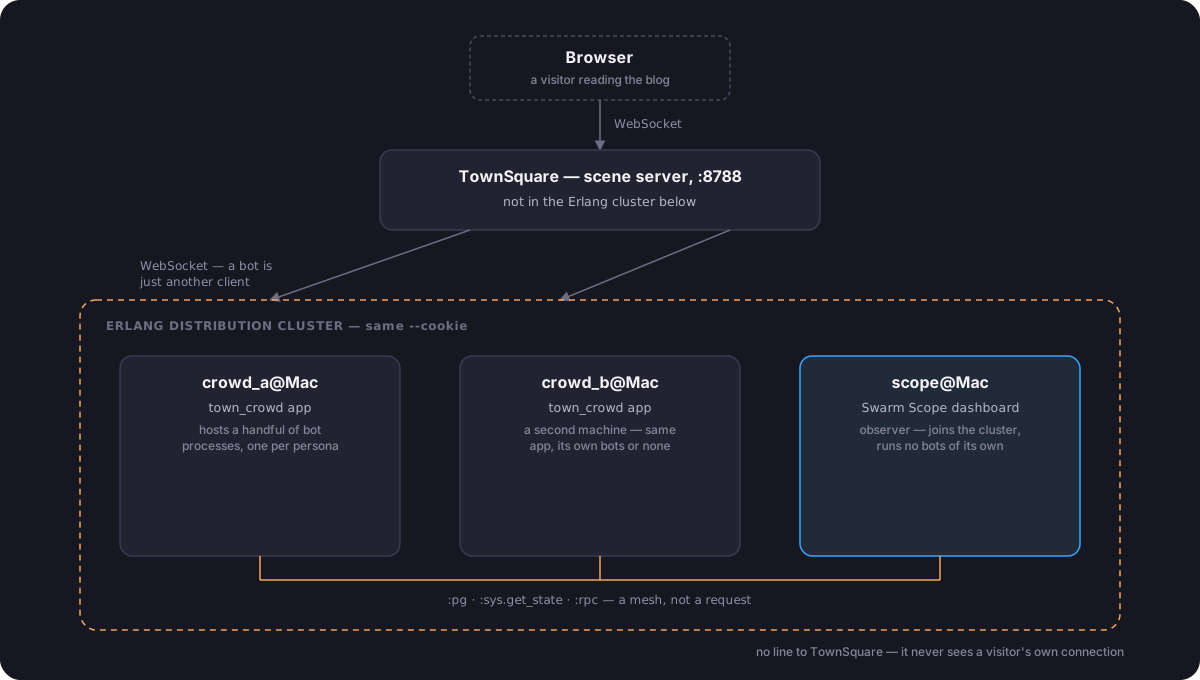
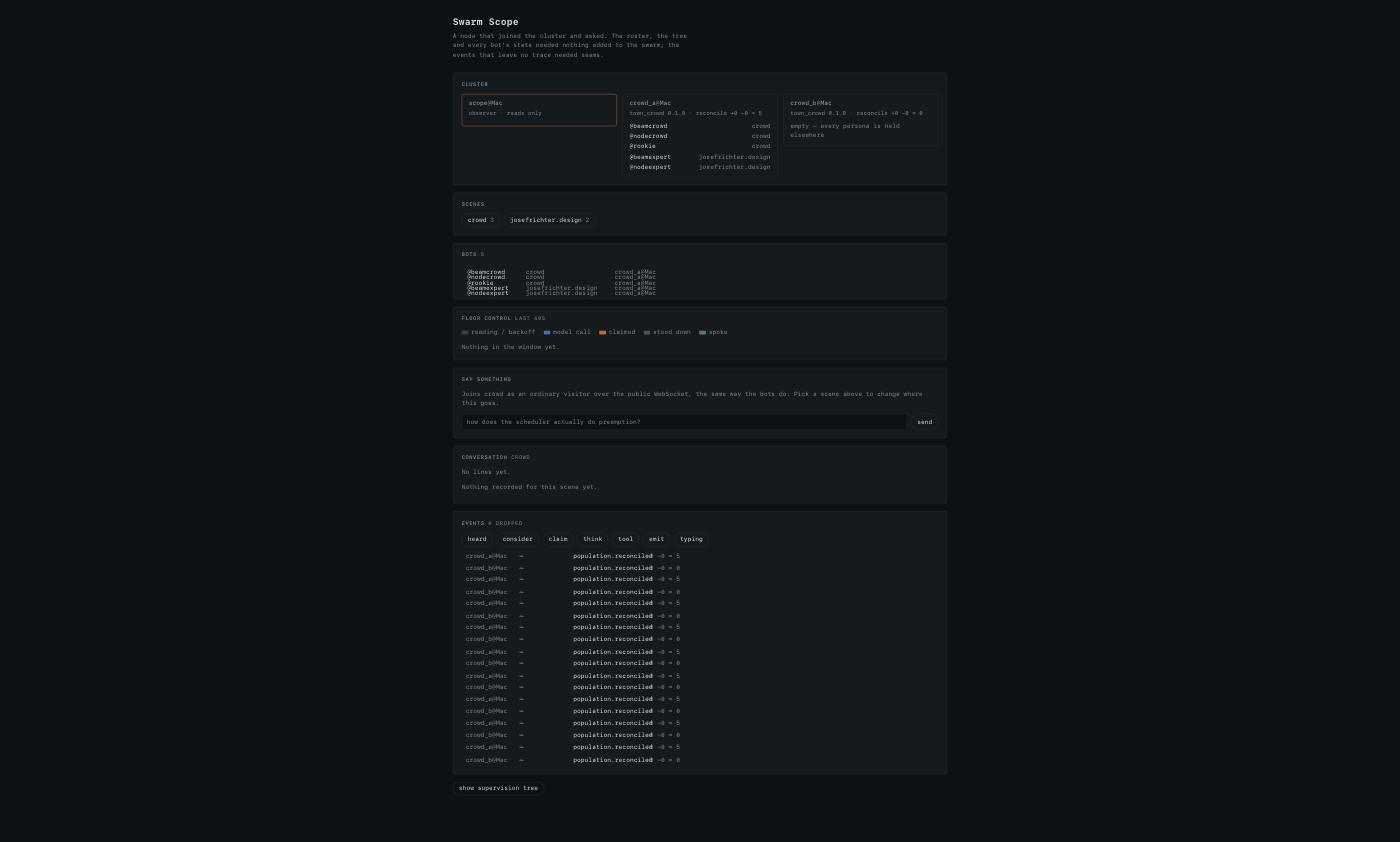
The swarm is a running Elixir app on two machines. I wrote a second, completely separate app. It joined the same Erlang cluster. Within a second it could list every bot, name the machine each one was running on, read any bot’s full internal state, walk the supervision tree, and pull the entire conversation history out of an in-memory table.
None of that required a single line of code in the swarm. No agent, no exporter, no collector, no metrics endpoint, no HTTP at all. The swarm has no idea it is being watched, in the specific sense that nothing in it was written with a watcher in mind.
Then I wanted to see the races, and that part cost twenty-six lines. Which of those two things is which turns out to be the actual subject.
What the product hides
Recall what the Crowd post claimed the bots do when a message lands in a room:
- every bot starts a reading delay that scales with the message length,
- that delay is biased by keywords, so the bot whose expertise matches jumps the queue,
- the first one to finish broadcasts a claim on that specific message,
- everyone else sees the claim and stands down,
- unless the message matched two experts’ keywords, in which case the claim is skipped and both answer independently.
Every word of that is true, and none of it is visible. What a reader sees is a stick figure that starts typing. The most carefully built thing in the project is also the least observable thing in it.
Here is that same moment, read off the finished dashboard. One human question, three bots in the room:
beamcrowd   consider.scheduled   topic mine     3648 ms
nodecrowd   consider.scheduled   topic other   11412 ms
rookie      consider.scheduled   topic other   13458 ms
beamcrowd   consider.decided     commit
beamcrowd   claim.broadcast      told 2
nodecrowd   claim.received       standing down
rookie      claim.received       standing down
nodecrowd   consider.decided     claimed_by_other
rookie      consider.decided     claimed_by_other
beamcrowd   think.start          respond · ollama:llama3.1:8b
The question was “how does the scheduler actually do preemption without blocking?” The word scheduler is in the BEAM expert’s keyword list and in nobody else’s, so its backoff came out at 3.6 seconds and everyone else’s at 11 and 13. It won the race it was rigged to win, said so, and the other two stopped. That is the mechanism, doing exactly what it says on the tin, for the first time in a form you can point at.
Part one - what needed nothing
Before any of that, the boring part, which is the part I actually find remarkable.
A bot in the swarm registers itself in a process group under the handle it answers to. That is a plain Erlang facility, :pg, and it replicates group membership to every connected node. So an observer that joins the cluster and starts the same named scope locally sees the whole directory:
:pg.start_link(:town_crowd)
{ref, groups} = :pg.monitor_scope(:town_crowd)
Two lines. The first gives me the current membership. The second turns it into a push stream: from then on I get a message every time a bot joins or leaves, anywhere in the cluster, with no polling and no subscription protocol to agree on. A crowd machine that comes up later starts appearing in it without being told anything.
That is the roster. The rest of the structural picture is the same shape:
| What I wanted to see | What it cost |
|---|---|
| Every bot, its handle, its scene, its machine | :pg.monitor_scope/1 |
| The supervision tree, live | DynamicSupervisor.which_children/1 over :rpc |
| Mailbox depth, memory, reductions per bot | Process.info/2 over :rpc |
| Any bot’s entire internal state map | :sys.get_state/2 |
| Every line ever spoken | the transcript table is :public, so :ets.tab2list/1 |
| Which app version each machine is running | :application.get_key/2 |
:sys.get_state/1 is the most useful one in that table. It is a standard OTP call that any GenServer answers, because GenServer implements the :sys debugging protocol whether its author thought about it or not. So I can ask a bot running in production, on another machine, written months before this dashboard existed, for its complete internal state, and get back the actual map: which peers it can see, how long its current claim lease has left, how many model calls it has in flight, what the last thing it heard was.
That interface was not built for this dashboard. :sys has been part of OTP for decades.
There is one thing the roster cannot see, and the exception is instructive. When you address a bot that lives under a different article, its process spawns a shadow that opens its own socket into your scene. Shadows never register in :pg, so they are invisible to the directory by construction. But they are children of a supervisor, so which_children/1 finds them anyway. Two independent views, and the gap in one is covered by the other, without either being designed to cover it.
Part two - what needed seams
Then I tried to draw the race. Polling could not do it, at any frequency.
A claim is this:
for pid <- BotRegistry.scene_members(st.scene), pid != self() do
  send(pid, {:claimed, key})
end
Fire and forget. Nobody records it. A moment after it lands, the only trace is a number in four separate claims maps, which tells you a claim exists but not who made it, when, or what the other three did about it. Poll at any frequency you like: an event that leaves no trace cannot be recovered afterwards.
Same for the decision not to speak. That is a cond returning {:noreply, st}, and there are four different ways to reach it. Nothing about the state afterwards says which.
So those get emitted. Twenty event types, from twenty-six call sites, all of the form:
Events.consider_decided(st, key, :claimed_by_other, claim?)
The design decision I care about most is that decision is an enum, not a boolean:
:calm | :claimed_by_other | :cooldown | :already_pending | :commit
Those are exactly the four guards that can turn a bot away, plus the one path through. A boolean would have thrown out the only interesting part. “Bot did not answer” is a metric. “Bot did not answer because another bot already called dibs” is an explanation, and it costs one atom.
The entire structural picture needed nothing. The events that leave no trace needed seams. No observability tool gets the second category for free, on any runtime. What the BEAM gave me was the first category, which on most stacks is also something you have to build.
How the events cross the wire
Telemetry handlers are node-local. My handler module does not exist on the crowd machines, so I cannot simply attach from the observer. The bridge is about forty lines that live in the swarm’s repo:
def handle_event(event, measurements, metadata, _config) do
  msg = {:scope_event, event, measurements, metadata, node(),
         System.system_time(:millisecond)}

  for pid <- :pg.get_members(:town_crowd, {:scope, :subscribers}) do
    :erlang.send(pid, msg, [:noconnect, :nosuspend])
  end

  :ok
rescue
  _ -> :ok
end
Subscribers appear by joining a process group and disappear when their node does, because that is already what :pg does for the bot directory. There is no registration endpoint and no cleanup.
The two flags on that send are the whole backpressure story, and they matter more than they look.
A telemetry handler runs in the same process that emitted the event, which here is a bot, mid-turn. A plain send/2 to a remote pid blocks the caller when the distribution buffer to that node fills up. So a slow dashboard, or one whose machine has wedged, would apply backpressure to the swarm it is supposed to be passively watching. :nosuspend returns instead of blocking and drops the event. :noconnect means an event never triggers a distribution handshake from inside a bot’s hot path.
Dropping is the correct failure here, and the dashboard counts what it dropped and puts the number on screen next to the feed, permanently, including when it is zero. A feed that only mentions loss when loss happens teaches you to read silence as completeness.
The rescue is there because :telemetry permanently detaches a handler that raises, quietly. A bug in this function should cost one event, not all of them.
Reading the room
Two questions I only asked once the thing was running: can I read a whole conversation, and can I see what a tool was actually asked?
Neither worked at first, and both failures were interesting.
The conversation turned out to live in two places, neither of which is a conversation. The swarm keeps a transcript in an ETS table declared :named_table, :public. That :public was almost certainly written so the owning process could read its own table without a round trip. It also means any process on any connected node can read the whole thing:
:rpc.call(node, :ets, :tab2list, [:town_crowd_transcript])
Every line, since the node booted, with no API and no cooperation. It is the most extreme example in the project of the argument the whole dashboard is making.
Except it is only half a conversation. Transcript.log/5 is called from a bot’s own emit path, so it records what bots said and never what they heard. A human’s half was written down nowhere at all: it exists in each bot’s rolling sixteen-line memory and then it is gone. So a room’s history, read from the swarm’s own records, is a monologue.
That is the second thing seams are for. One more event, fired when a message arrives:
Events.heard(st, disp(name), text, human?, msg_key(who, text))
Every bot in the scene hears the same message, so this fires once per bot. They collapse on msg_key, which is the same key the claim machinery already uses for the same “one message, many bots” problem. Reusing it was not cleverness, it was noticing that the problem had already been solved twenty lines away.
The dashboard splices the two sources and says where the seam is: bot lines all the way back, both sides from the moment the observer attached. It does not pretend the earlier stretch was a monologue, and it does not pretend to know what was said before it arrived.
One more thing had to be undone. A reply is emitted as several bubbles split on sentence boundaries, seconds apart, so the typing animation looks like someone composing. Read back as a log, that is one reply shredded into four rows. The conversation view joins consecutive chunks from the same bot back into the one utterance they were always meant to be, with a fifteen-second gap treated as two separate things said rather than one long one.
The tool calls were worse, and more obviously wrong once seen. The trace said this:
tool.start   read_url
tool.stop    read_url → 8412B
Which tells you nothing. Which URL. What query. What came back. All of it was thrown away at the seam, because I had written the tool span before I had ever looked at one.
The fix is that the argument travels, capped, along with a preview of the result and how many rounds of the loop remain:
nodecrowd  tool.start   web_search: Elixir beam vs Node.js event loop concurrency
nodecrowd  tool.stop    4017B in 3597 ms, round 1 of 3
           result       ========== https://lite.duckduckgo.com/lite/?q=... ==========
                        DuckDuckGo  All Regions Argentina Australia Austria Belgium...
And it showed something useful immediately: a scraped DuckDuckGo results page, most of it a country picker. Without a Tavily key the web search falls back to scraping, and the model was being handed several kilobytes of navigation furniture and asked to reason over it. The reply it produced afterwards began “based on the search results”, which is exactly the kind of sentence that sounds fine until you see what the search results were.
I would not have found that by reading the code. The code is correct. It is the value flowing through it that was junk, and the only way to see a value flowing through a Task that has already exited is to have asked it to say so on the way past.
Two bugs that only exist between machines
Both of these are the same bug, which is why I am writing them down.
The first. I stamped each event with System.monotonic_time(:millisecond), out of habit, because monotonic time is the right clock for measuring durations. It is the wrong clock for this. Monotonic time is per-VM: its origin is whenever that node happened to boot. Two crowd machines have unrelated origins, so their stamps cannot be placed on one axis at all. The timeline would have drawn two machines’ events at an arbitrary offset from each other and looked entirely plausible doing it.
Durations are the opposite case, and they stayed monotonic: each one is measured inside the node that produced it and travels as a finished number. Wall clock for when, node-local monotonic for how long.
The second, which I only caught because I tested the thing I had just built. The dashboard reports whether a bot is currently in deferential mode by reading calm_until out of its state and subtracting now. I paused a bot, and it read 86,400,296 ms remaining, correct. I resumed it, and it read 295 ms.
It should have read zero. calm_until is a monotonic deadline set on the crowd node, and I was subtracting the observer’s monotonic clock from it. The 295 was the gap between when the two VMs booted. Not a rounding artefact: a number that looks like an answer and is not one.
The fix keeps everything else in place and asks the right node for its own clock:
:rpc.call(node(pid), System, :monotonic_time, [:millisecond])
I could instead have made the bot store a wall clock. I did not, and would not: changing what a process records to suit something watching it is exactly the direction of dependency this whole exercise is trying to avoid.
There is a third detail in the same family. When the clock cannot be read, the field is nil, and the UI renders “unknown”, not “no”. Nil is not zero. An observability tool that quietly converts I could not find out into it is fine is worse than one that crashes.
Hologram, honestly
I built the UI in Hologram, which compiles Elixir to JavaScript and runs your component state in the browser. Jido used it for their agent-native Slack clone recently and made the LiveView comparison at length, so I will only report what it was like for this specific shape.
The shape is unusual in a way that suits it. A dashboard is mostly local state sitting on top of a high-frequency server stream. Which bot is selected, which scene is filtered, which trace is expanded, whether the tree is collapsed: none of that has anything to do with the swarm, and in LiveView every one of those is either a round trip or a JavaScript hook. Here they are Elixir functions that run in the browser, and the split shows in the code itself: read a module and you can see it. Every action is something the reader did. Every command is something that touches a running process somewhere else.
The concrete win, and it is the one I would actually make the case on: the same Elixir functions shape a telemetry event on the server and format it in the browser. There is no second set of types describing the same events in another language, and therefore nothing to drift.
The concrete cost, twice over. Hologram 0.10 re-renders the whole page when an action runs, and reconciles list comprehensions by position rather than by key. So one broadcast per telemetry event is not viable. Events accumulate in a GenServer and leave as a single batched frame every 100 ms. I want to be fair about this: pacing a stream to the refresh rate of the thing consuming it is what you would do anyway. But I did it because I had to, not because I chose to, and that is a different sentence.
The other cost is testing. There is no LiveViewTest equivalent yet. What I did instead was pull everything with logic in it out of the components: the timeline’s geometry is a pure function over an event list, and it has thirteen tests, including one for a real bug where a finished model call was drawn twice, once correctly and once as a bar claiming it was still running. That is a good habit that the framework’s gap forced on me, which is a backhanded compliment but a genuine one.
And the version numbers, since they are the fair thing to lead with: 0.11.0, released two weeks ago, pre-1.0, roughly 6,000 total downloads. I pinned 0.10.1 because 0.11 requires Elixir 1.19 and OTP 28.1, and the swarm runs 1.18.4 and OTP 27, and matching toolchains is worth more to me than the newest version.
Steering, which was three lines
Watching is half of it. The dashboard can also pause a bot, retire it, and change which model is thinking inside it, mid-conversation.
I had budgeted real work for this and it was not there, because the swarm was already built in a way that made it free.
Pausing a bot is not a new concept: calm_until is a deadline that already exists, set when a human types “slow down”, and consulted everywhere a bot decides whether to volunteer. Pause is that deadline, far away. Resume is that deadline in the past. That is the entire feature.
Changing the model is better. A bot’s brain is one string on a map, and the dispatch reads it on every call:
def handle_info({:scope_set_model, model}, st) when is_binary(model) do
  Events.model_swapped(st, st.persona.model, model)
  {:noreply, put_in(st.persona.model, model)}
end
Click a different model in the dropdown and the next turn runs on it. A call already in flight finishes on the old one, which is correct and worth watching happen. There was no runtime model-swap machinery to build. There was a string to overwrite.
The one thing that did need building: retiring a bot does not stick, because the reconcile pass notices the handle is missing cluster-wide and starts it again within fifteen seconds. So Population learned to hold a handle. That is the only new concept in the entire control plane, and it exists because the swarm is self-healing, which is a good problem to have.
All of it is behind two independent environment flags, both off by default, one on each app. That is not authorization and I am not going to pretend it is. Anyone who can reach the page can steer a swarm that has its own flag open. A public deployment needs a plug in front of the router or a private network. Hologram has no auth layer yet.
Would this be hard in React and Next.js?
The honest answer has two halves, and they point in opposite directions.
The dashboard itself: no. React draws timelines, trees and live feeds perfectly well. The advantage I described above is coherence and the absence of duplicated types, not capability. Anyone claiming React cannot render this is selling something.
The thing being observed, and the way I observed it: yes. Three specific walls, and none of them is about drawing.
There are no addresses. In Node your agents are objects in one heap. There is no pid, no mailbox, no per-entity scheduler. So there is nothing to call :sys.get_state on, and no supervisor to enumerate. Every bit of visibility must be designed in ahead of time: an emitter on every agent, a store, a metrics push. You cannot decide after deployment that you now want to see something, because the thing you want to see has no name.
The observer shares the loop. A wedged agent in Node occupies the same event loop as the code trying to report on it, so your dashboard goes quiet exactly when you need it most. The per-bot isolation that lets each one block on its own model call is the same property that makes the reporting trustworthy.
Two instances means infrastructure. Fan-out needs Redis pub/sub, the roster needs a shared store, and the “every node sorts the pid list and kills its own loser” reconcile becomes a distributed lock or a leader election. I wrote about that in the Crowd post when it was a deployment story. The dashboard just makes the difference legible: two columns, each showing which processes it actually holds.
Worth adding, since it is the practical shape of the thing: Next.js’s deployment model is actively hostile to long-lived stateful agents. You would run a separate always-on Node service anyway and put Next in front of it, so “built in Next.js” would really mean “built in Node, with a Next dashboard”.
The short version: React is a fine way to draw a swarm. The BEAM is what lets you look at one you did not plan to look at.
What carried each piece
| The observability problem | What actually carried it |
|---|---|
| Who is running, and where | :pg.monitor_scope/1, cluster-wide, push not poll |
| The tree, including processes that register nowhere | DynamicSupervisor.which_children/1 |
| A live process’s complete internal state | :sys.get_state/2, an OTP facility older than the app |
| Every line ever spoken | a :public ETS table and one :rpc |
| Which build each machine is running | :application.get_key/2 |
| Events that leave no trace | twenty-six :telemetry calls, and nothing else would have worked |
| What a human said, which was durable nowhere | one more event, deduplicated on a key the claim machinery already had |
| What a tool was actually asked, and what came back | the argument and a capped result preview, on the span |
| Getting those events off the node | a :pg group and send/3 |
| Never slowing the thing being watched | [:noconnect, :nosuspend] |
| Pausing a bot | a deadline field that already existed |
| Changing its model mid-conversation | overwriting one string |
| Making a retirement stick | the only new code in the control plane |
The honest part
I have written the sentence “I connected a node” a few times here and I want to be precise about what it does and does not cover.
It covers the entire structural picture: what exists, where, in what shape, holding what state, having said what. That is a real and slightly startling amount, it required nothing from the observed system, and on most runtimes each item on that list is a project.
It does not cover events that leave no trace. Those were twenty-six lines in the swarm’s own repo, and no runtime gives you those for free, because the information does not exist anywhere until something records it.
What the BEAM changed is not that observability became free. It is where the line falls. On most stacks, the line sits at the very beginning: you instrument first, and you can only ever see what you thought to instrument. Here the line sits much further along, past everything structural, right at the boundary of things that were never written down. Everything before that boundary I got by asking, months after the fact, from an app that had never heard of me.
Further reading
- The bots themselves and why the realtime core is Elixir, the two posts this one sits on top of.
- Jido Assembly, the framework-shaped version of the same argument, and the reason I looked at Hologram at all.
:sysand:pg, the two modules doing most of the work above.:telemetry, and specifically thatspan/3does not merge start metadata into the stop event, which cost me an afternoon of nil handles.- Hologram, pre-1.0 and moving.